Clustering in retail

In the contemporary world, most stores contain tens of thousands of products, are visited by thousands of buyers, and each year it becomes more and more difficult to deal with such a flow. There are several powerful tools which can help with managing this problem. The first approach is implementing retail business intelligence (see our previous article for more details). Another possible solution is to select a group and interact only with this small part. For example, one can create targeted promotions and recommendations for a selected group of customers or arrange a sale on a group of products. Such a trick will help to decrease the effort level but at the same time ensure the success of the campaign because only the most appropriate segment will be involved. It sounds good, doesn’t it? But how to determine the most suitable groups? The answer is clustering or segmentation. The difference between these two techniques has been already explained in the article Differences between Clustering and Segmentation. In the present overview, we will be focused on clustering. Clustering is usually a machine learning (ML) technique that allows to partition objects into subgroups (clusters) in order to get the most similar objects in the same cluster. Moreover, distinct objects should be in different clusters.
Clustering is a very strong tool that should increase your business efficiency.
Using Cluster Analysis for retail: Possible Use Cases
In this chapter, possible implementations of clustering in retail will be briefly considered. If each object can be described by a set of numerical features (length, width, weight, etc.), it is convenient to represent objects as points in a coordinate space. The ML clustering algorithm will analyze the position of points and gather the closest points in the same group.The most commonly used families of clustering algorithms are described in one of our articles. The objects for clustering in retail could be users, products, stores, etc. Let’s have a look at each variant in more detail.
User Clustering
The possible features could include age, total cost, and total number of visits. By selecting age and total cost, one can possibly (everything will depend on the custom data) determine young users with high spend or, conversely, identify old users with low spend. Considering, for instance, total cost and total number of visits, one can find a group who spends a lot but does not visit frequently. In this case, it will be wise to create a promotion and attract such users to the store (they will possibly generate good revenue during their visit).
Each cluster will be characterized by its set of favorite products (brands, categories, etc.), average age, average spending value. Such information can be also successfully used for making complaints, promotions or sales.
Product Clustering
In this case, possible features for product clustering could include revenue, profit, number of unique users who bought a product, frequency of purchase, transportation or storage costs, size (volume), etc. Clustering analysis could assist in identifying unpopular products (considering, for instance, revenue and frequency of purchase) or inefficient products (if one considers, for example, profit and storage costs). There are many more interesting possibilities; you just need to be a bit creative to uncover them.
Retail Store Clustering
One can choose total sales, total number of items sold, total number of visits, total profit, store area, maintenance cost, etc., as features for retail store clustering. By selecting, for example, total sales and store area, it will be possible to find stores with low sales but large areas. For such stores, it would be useful to consider making some rearrangements, such as reducing the area of some sections, outsourcing some parts, etc. Similar insights can be obtained by examining total sales and maintenance costs.
More sophisticated user clustering with Mobiry
Clustering in retail can also be employed to separate users based on their preferences. To implement this, one should be aware of the purchase history of all users. This information enables the definition of a “distance” between users. Roughly speaking, in such a space, users are close together if they have purchased many identical products. After constructing such a space, one could utilize the described algorithms to cluster users according to their preferences.
In Mobiry, we employ a similar approach for clustering. Without delving too deeply into the details, we create an N dimensional “preference space” and assign each user a position in this space (the proper value of N depends on the specifics of buying history, in most cases N>3). Within this space, we apply a clustering algorithm to unite similar users into clusters. The number of clusters here is a flexible parameter. Choosing a greater number of clusters provides a more detailed partition into groups of particular interests.
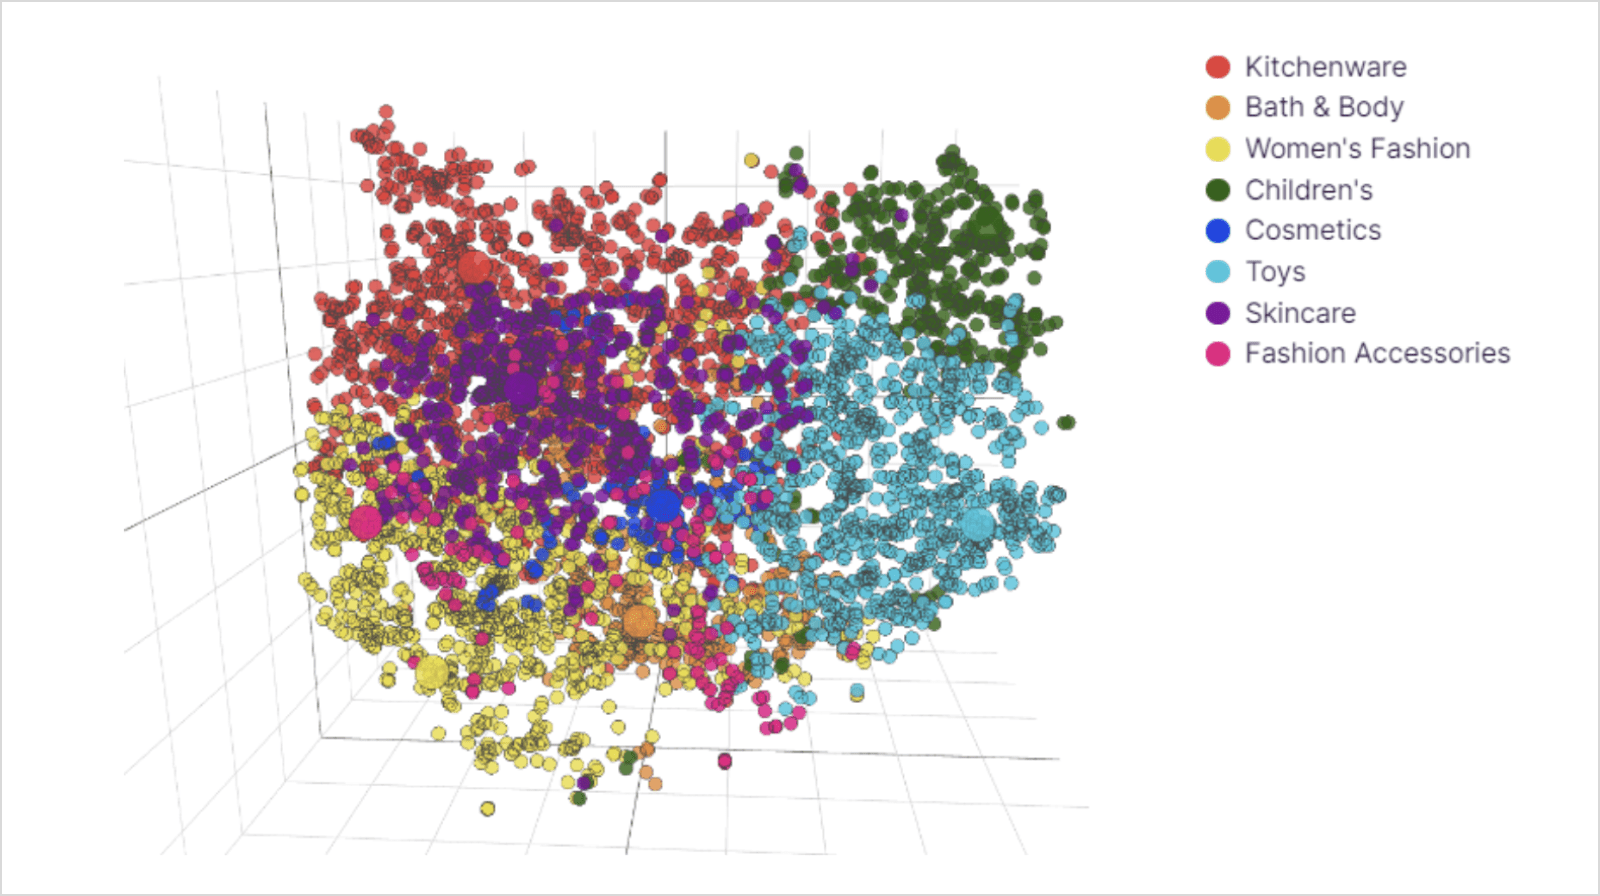
To assess the quality of the obtained clustering, it is valuable to visualize the clusters. In our algorithm, where the number of dimensions N is greater than 3, clusters cannot be visualized properly. This challenge can be addressed by reducing the number of dimensions using one of the reduction algorithms. The most popular reduction algorithms include principal component analysis (PCA) and its modifications, different various versions of discriminant analysis (e.g., linear discriminant analysis - LDA, multiple discriminant analysis - MDA), t-distributed stochastic neighbor embedding (t-SNE), and others. The selection of an algorithm also depends on the specifics of the purchase history. The application of a reduction algorithm results in the visualization of customer clusters in a 3-dimensional space.
Figure 1 illustrates an example of cluster visualization in Mobiry. The plot displays users separated into 8 clusters. A notable characteristic of this clustering is the preference for brands (such as Chanel, Longchamp, etc.) within specific departments (Kitchenware, Toys, Skincare, etc.). We consider not only individual brands but also pairs of “brand-department” because a single brand can be represented in different departments (for example, in Fragrances, Skincare, Fashion). To enhance the quality of results, specifying the department is crucial. This refinement aids our algorithm in better understanding the preferences of users. Each cluster is named after the favorite department of users within that cluster. The larger points represent cluster centers, and the closer users are to a cluster center, the more pronounced their interest in the most popular cluster attributes (brands, departments).

Fig. 1. Visualization of clusters in Mobiry.
Plots like these serve as a valuable tool to assess the quality of the obtained clustering. If the groups are well-separated, with no users from one cluster encroaching into the area of another group, then the clustering is considered to have good performance. On the contrary, if there is overlap between clusters, adjustments to the clustering parameters may be necessary. These adjustments could include modifying the number of clusters, the number of users, the set of attributes, and other relevant parameters to enhance the effectiveness of the clustering algorithm.
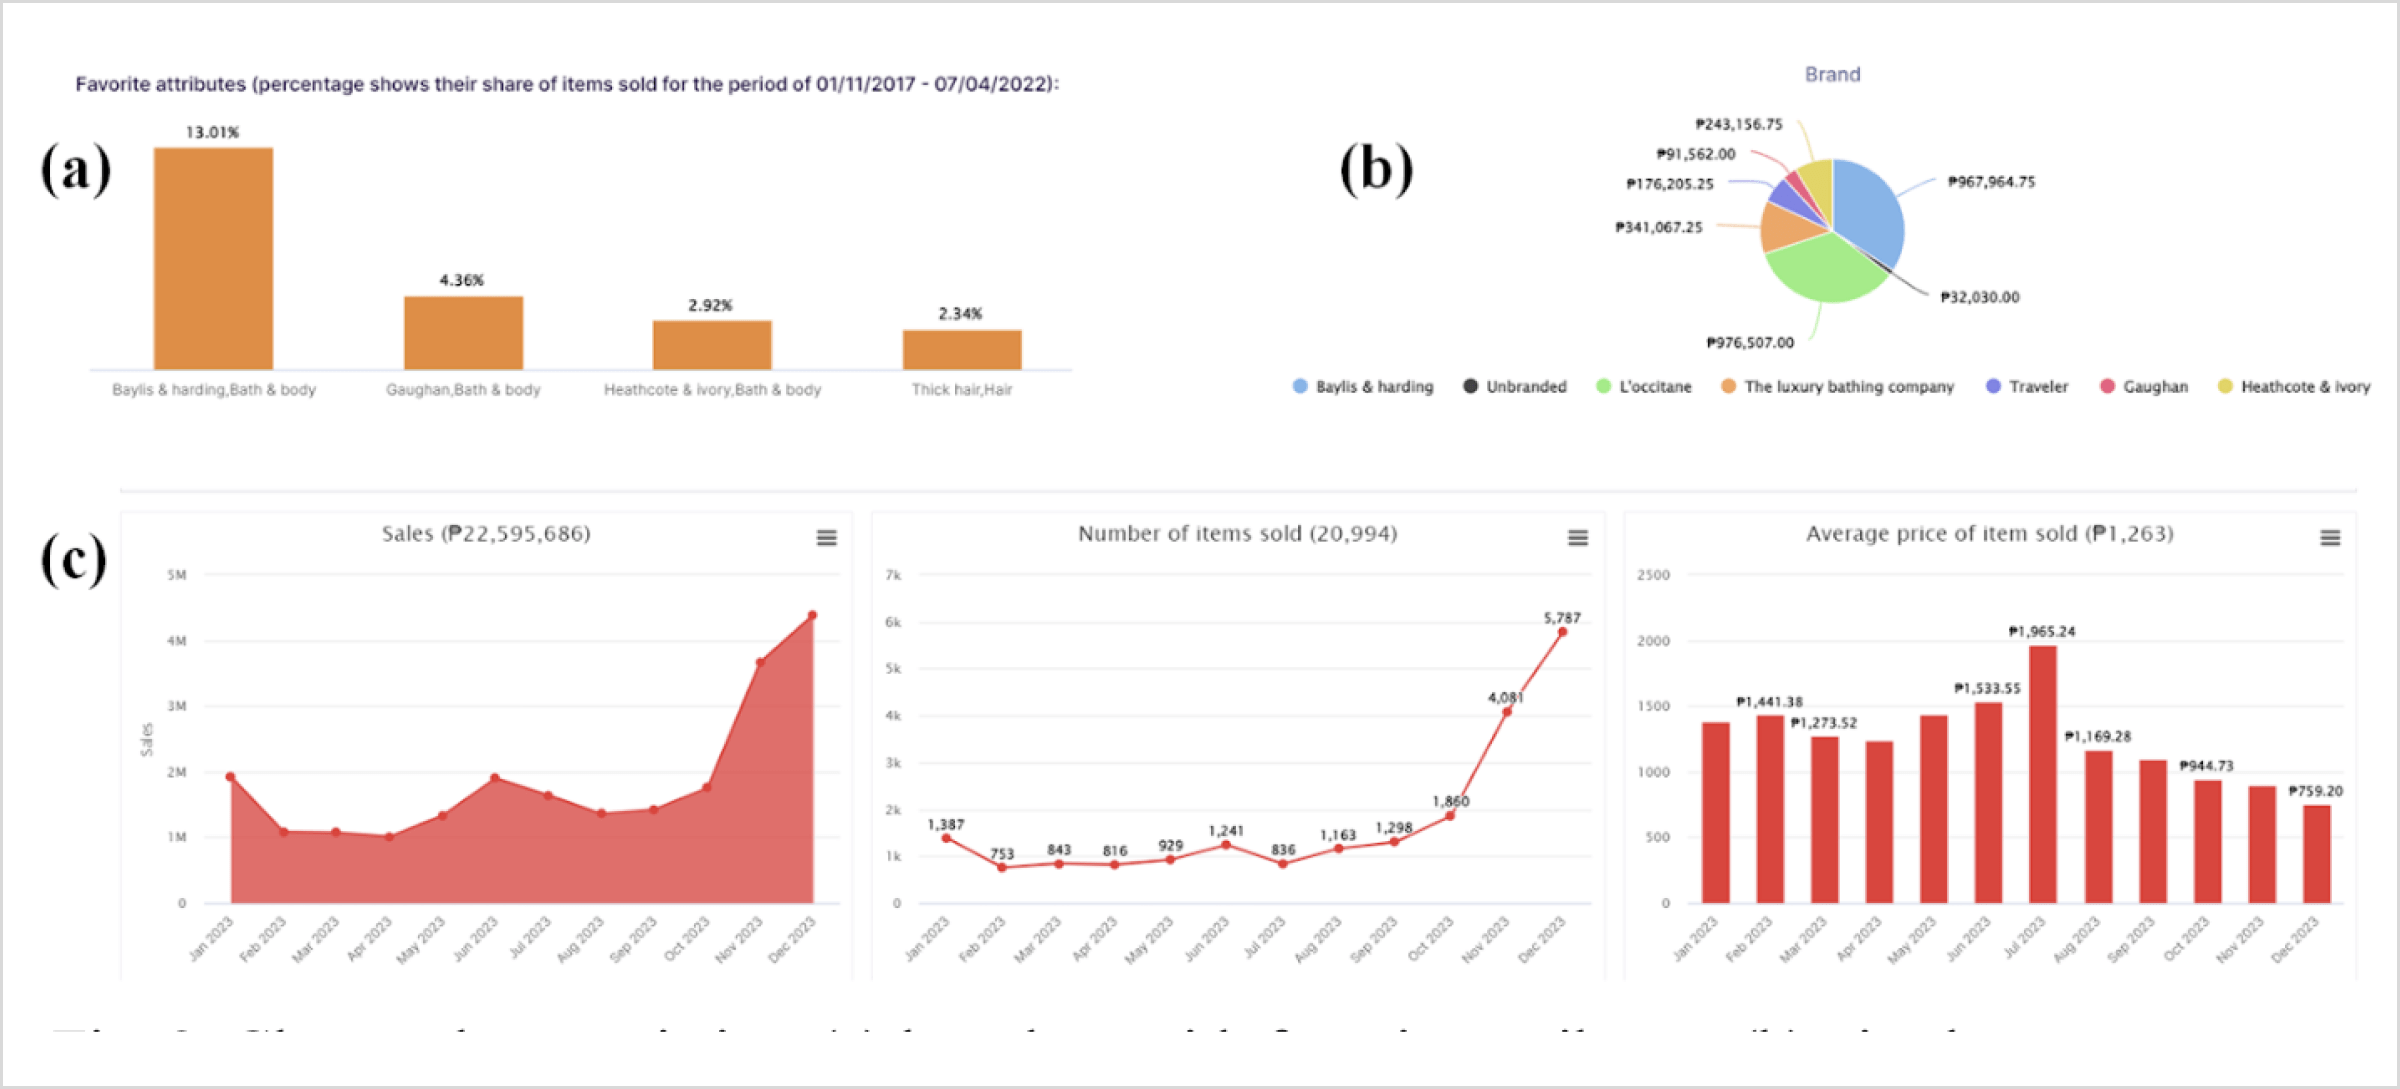
In Mobiry, for each cluster, we furnish a set of visualizations, including a bar chart depicting favorite attributes (Fig. 2(a)), a pie chart showcasing top favorite brands (Fig. 2(b)), sales statistics over time (Fig. 2(c)), and various other useful information. This comprehensive information proves invaluable in gaining a deeper understanding of users' behavior within clusters, thereby facilitating the creation of targeted offers, promotions, and sales tailored to each specific cluster.

Fig. 2. Cluster characteristics: (a) bar chart with favorite attributes, (b) pie chart with top favorite brands; (c) sales statistics by time.
Conclusion
In the article, we have detailed the powerful tool of clustering for retail application. We highlighted its versatile applications such as user clustering, product clustering, retail store clustering, and more. The multitude of use cases and obvious advantages position cluster analysis as an almost indispensable assistant in maximizing profits leveraging the capabilities of the most powerful AI instruments.
Contact us

